Building EV infrastructure in rural Africa is a challenge, but data-driven approaches are making it possible. Here’s a quick look at why this matters and how it’s being tackled:
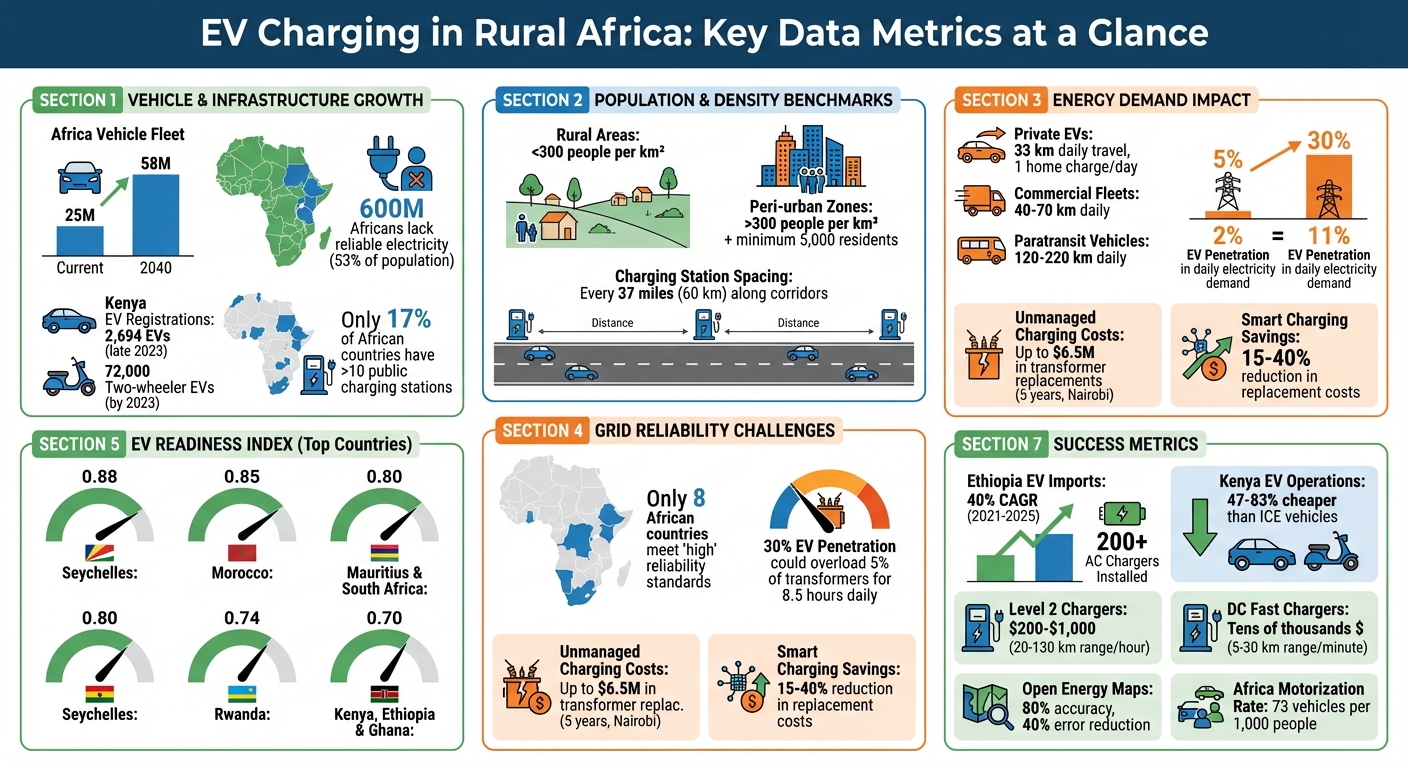
- Vehicle Growth: Africa’s vehicle fleet is projected to grow from 25M to 58M by 2040, with EVs playing a key role.
- Infrastructure Gaps: 600M Africans lack reliable electricity, and rural areas face major grid reliability issues.
- EV Adoption: Countries like Kenya and Ethiopia are leading, with Kenya registering 2,694 EVs in late 2023 alone.
- Smart Solutions: Tools like Open Energy Maps and smart charging strategies are helping optimize grid use and cut costs.
- Key Metrics: Population density, grid reliability, and energy demand are crucial for planning EV charging stations.
EV Infrastructure Metrics for Rural Africa: Key Statistics and Readiness Indicators
Population and Geography Data Metrics
Population Density Requirements
Population density plays a key role in identifying suitable locations for charging stations. According to the Eurostat "Degree of Urbanisation" framework, rural areas are defined as having fewer than 300 people per square kilometer, while peri-urban zones exceed this threshold and must include at least 5,000 residents. These benchmarks help establish the minimum customer base needed to justify investments in infrastructure.
In Sub-Saharan Africa, where over 600 million people (53% of the population) still lack access to electricity, these metrics become even more critical. Charging stations in sparsely populated areas often struggle to generate enough revenue to cover costs. Kenya offers a practical example: by 2023, the country had registered 72,000 two-wheeler EVs, with most concentrated in higher-density peri-urban areas where the population can sustain charging infrastructure.
Planners need to adjust these thresholds to reflect each country’s unique urban and rural makeup. Babak Khavari and his team at KTH Royal Institute of Technology emphasize this point:
"Extending the grid to rural communities might not be economically attractive and therefore (as budgets are limited) these settlements often remain un-electrified".
This makes it clear that charging stations should focus on areas with both adequate population density and existing electricity access. These insights naturally lead to the use of advanced mapping tools to fine-tune site selection.
Geographic Mapping and Site Access
High-resolution mapping tools have revolutionized how planners identify viable charging station locations. These tools provide a much clearer picture of settlement layouts compared to older, less precise methods. For instance, the High-Resolution Settlement Layer (HRSL) achieves a recall value of 0.84 in rural areas, far outperforming the Global Human Settlement Layer (GHS-POP), which scores just 0.04. This level of detail helps capture the true dimensions of settlements instead of relying on blurry, pixelated approximations.
In March 2024, the IEA and MIT introduced the "Open Energy Maps" tool for Ghana, Senegal, and Uganda. Using AI to analyze satellite imagery and building footprints, this tool achieves over 80% accuracy and reduces error by 40% compared to earlier methods. Such precision enables developers to identify "anchor customers" like large industrial or commercial facilities, which can provide a stable revenue base for charging stations.
Road connectivity is another key factor in assessing economic feasibility. Sites near major roads and markets often indicate higher income levels and a greater ability to pay for charging services. For rural Africa, this means prioritizing high-traffic corridors. Charging stations are typically spaced about every 37 miles (60 kilometers) along these routes, aligning with the EU’s AFIR mandate for charging infrastructure. This corridor-based strategy ensures both accessibility and economic viability, even in less densely populated areas.
sbb-itb-99e19e3
Energy Demand and Grid Reliability Metrics
Household and Transport Energy Demand
When analyzing rural energy needs, it’s crucial to separate household and transport demands. The World Bank’s Multi-Tier Framework offers a helpful way to categorize household energy use. For instance, Tier 3, which equates to roughly 365 kWh per household annually, serves as a benchmark for planning rural electrification projects. This tier includes basic appliances like refrigerators, washing machines, and lighting, which are also indicators of a community’s readiness to support electric vehicle (EV) charging.
Transport energy needs, however, vary widely depending on the type of vehicle. Private EVs typically travel about 33 kilometers daily, requiring a single home charge per day. On the other hand, commercial fleets cover 40–70 kilometers daily, while paratransit vehicles such as e-buses and e-matatus can travel between 120 and 220 kilometers per day. The charging demands differ significantly – only 15% of e-matatus and 60% of e-buses can complete their daily routes on a single charge, meaning multiple charging sessions during the day are often necessary.
This increasing reliance on EVs poses challenges for local grids. For example, in Nairobi, a modest 5% EV penetration could cause a 2% rise in daily electricity demand. If that figure jumps to 30%, daily demand could grow by 11%. Across Africa, accommodating a 30% transition to EVs would require more than 20% of the projected electricity demand growth over the next decade.
Additionally, "range anxiety" among drivers often leads to more frequent charging sessions, which can double peak electricity demand due to overlapping charging times. This creates worst-case scenarios for energy planners, especially during evening hours when multiple vehicles may charge simultaneously.
These details about energy demand provide essential context for understanding the challenges of maintaining a reliable grid, which we’ll explore next.
Grid Reliability and Electricity Access
Grid reliability plays a critical role in determining whether EV charging can be supported. Metrics like SAIFI (System Average Interruption Frequency Index) and SAIDI (System Average Interruption Duration Index) are used to assess how well a grid can handle EV integration . Unfortunately, many African utilities face frequent outages and system inefficiencies. At present, only eight African countries meet the "high" reliability standards required for widespread EV adoption.
One major issue is transformer capacity, especially in rural areas. Distribution transformers typically operate safely within 30–125% of their rated capacity. However, with 30% EV penetration, unmanaged charging could overload around 5% of transformers for an average of 8.5 hours daily. This kind of overloading not only accelerates wear and tear but can also lead to premature failures. For urban areas like Nairobi, the costs are steep – unmanaged private EV charging could lead to transformer replacement expenses of up to $6.5 million within just five years.
There are solutions, though. Smart charging strategies can help mitigate these issues. For example, shifting private EV charging to off-peak hours (typically between 1:00 AM and 6:00 AM) could reduce transformer replacement costs by 15–40%. Paratransit vehicles, which often charge during daytime off-peak hours, can also help improve the grid’s load factor. In fact, coordinating just half of all EV charging could deliver benefits equivalent to a 30 MW Battery Energy Storage System – a system that would otherwise cost around $32 million.
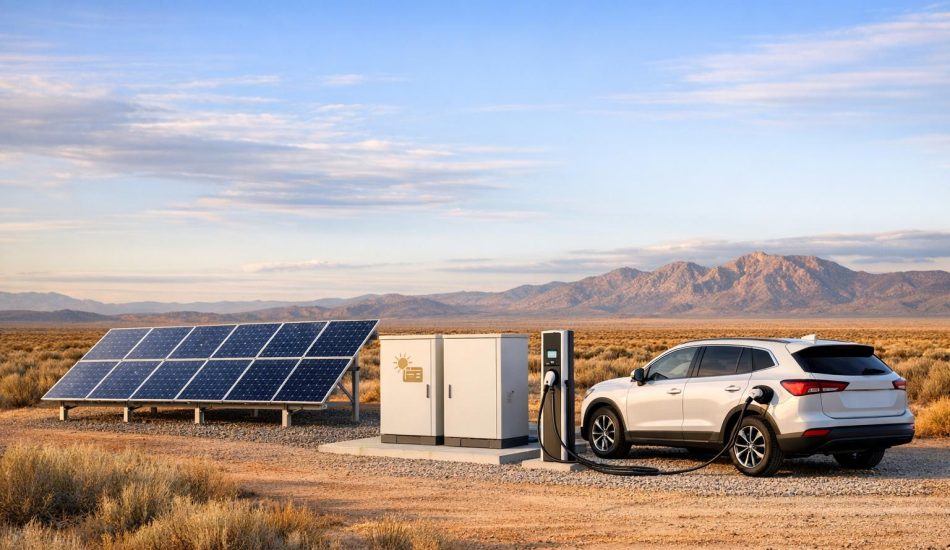
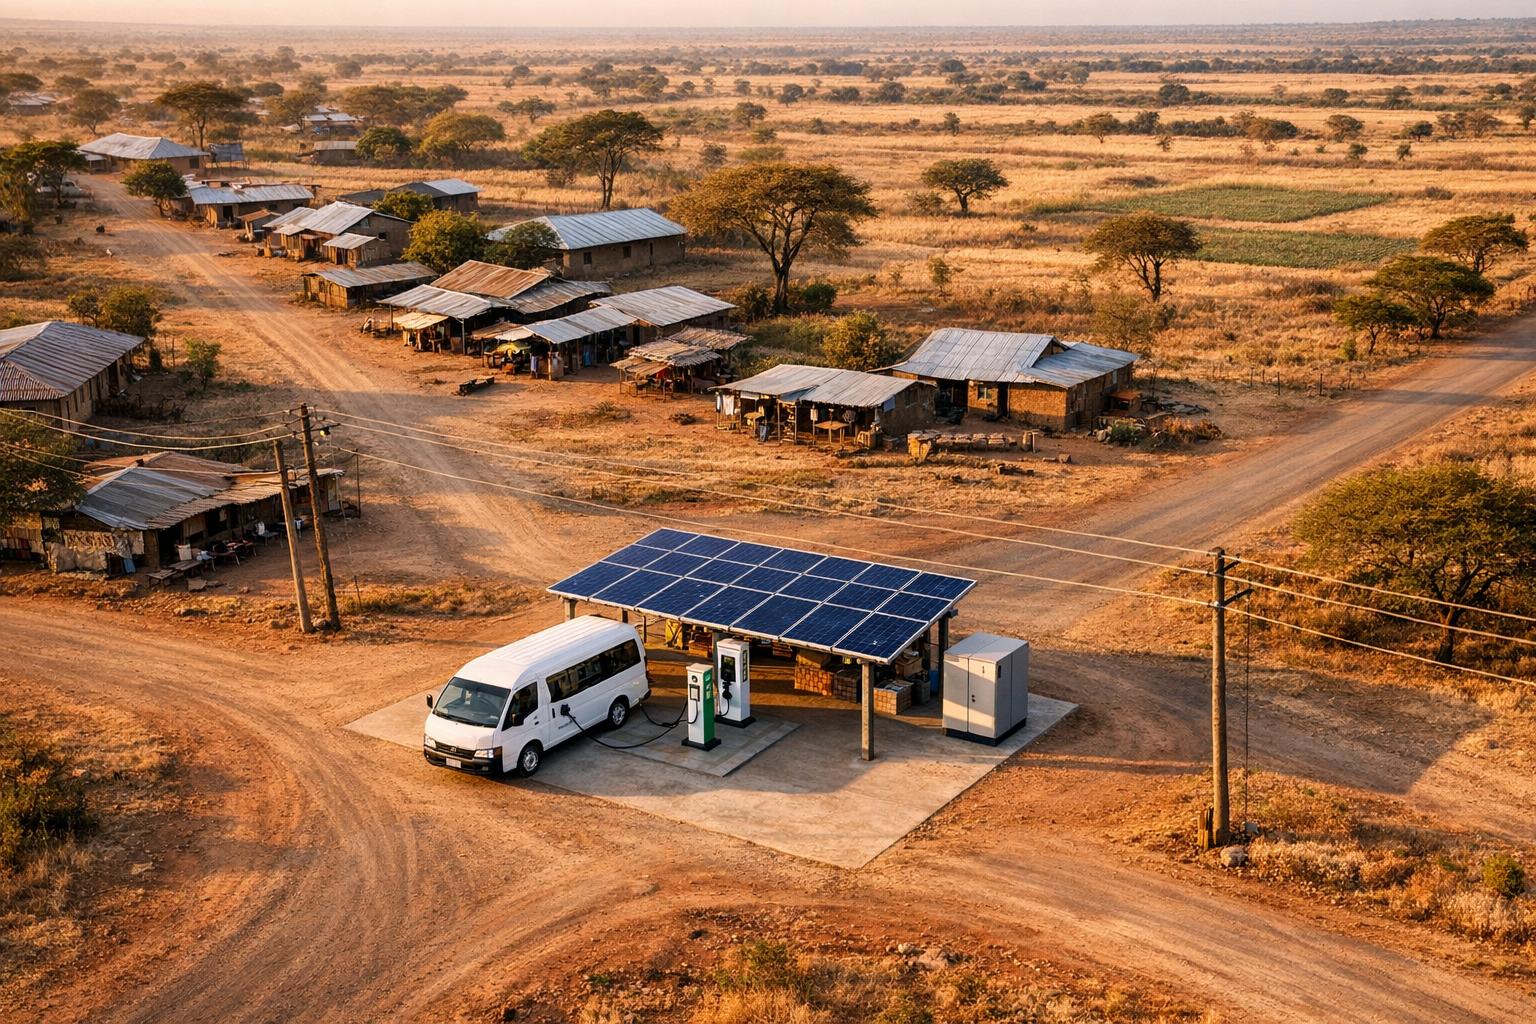
For rural areas with unreliable grids, off-grid solutions become a necessity. In countries like Ethiopia, Kenya, and Rwanda, off-grid systems already provide electricity to 49% of rural residents, compared to just 3% in urban areas. Solar-powered mini-grids and standalone systems offer a practical alternative, delivering Tier 3 electrification at a cost of $0.03 to $0.16 per person per day. These systems are particularly valuable in regions where extending the grid is prohibitively expensive.
Charging Infrastructure and EV Readiness Metrics
EV Readiness Indicators
To assess the feasibility of electric vehicles (EVs) in rural areas, several factors come into play: grid reliability, motorization rates, and access to financial services. While grid reliability remains a challenge in many parts of Africa, these metrics, when combined with data on energy demand and population density, help chart a tailored approach for developing rural EV infrastructure.
Motorization rates reveal both the current low adoption of EVs and the potential for future growth. On average, Africa has just 73 vehicles per 1,000 people, with 76% of countries reporting fewer than 100 vehicles per 1,000 people. This suggests that as incomes rise, there could be a substantial increase in vehicle ownership. However, financial inclusion remains a barrier. Only 13% of Africans over the age of 15 have accessed loans through financial institutions or mobile money, compared to a global average of 30%. Without better access to financing, even a favorable total cost of ownership may not be enough to drive EV adoption.
The Energy for Growth Hub‘s EV Readiness Index sheds light on the countries best positioned for investment in charging infrastructure. Seychelles tops the list with a score of 0.88, followed by Morocco at 0.85. Mauritius and South Africa both score 0.80, Rwanda comes in at 0.74, and Kenya, Ethiopia, and Ghana each score 0.70.
"Africa lacks rigorous EV data and analysis, limiting policy and investment. Anecdotal narratives dominate the discourse… focusing narrowly on promising EV startups in a few hotspot countries." – Rose Mutiso
These readiness indicators not only underline the challenges but also provide a roadmap for strategically deploying charging infrastructure in rural areas.
Charging Station Benchmarks
Using grid and energy demand data as a foundation, planning benchmarks refine the infrastructure requirements for EV charging. Current standards recommend one public charging point for every 30 EVs and one workplace charging point for every three EVs. However, only 17% of African countries currently have more than 10 public charging stations.
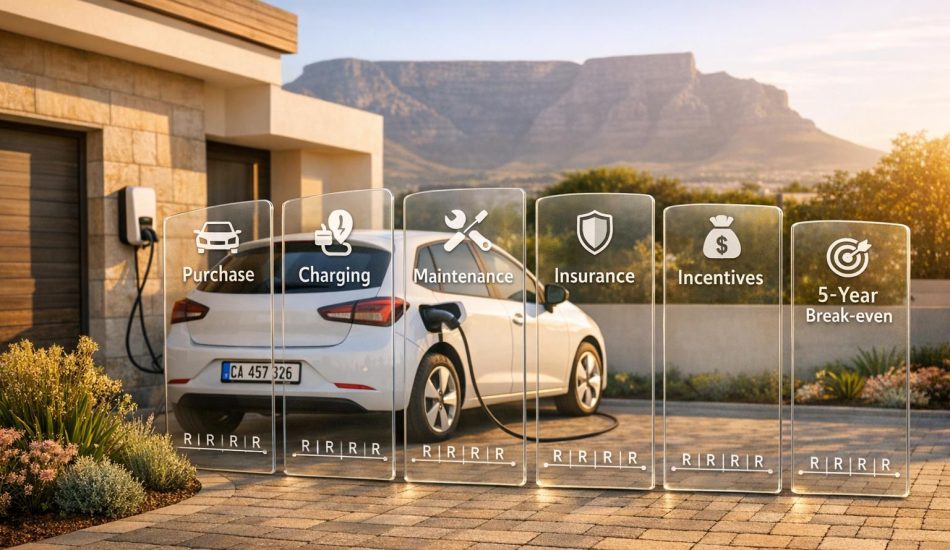
Two-wheelers present a practical and affordable entry point for rural electrification. Over a five-year period, they are estimated to cost 25% less than their internal combustion engine counterparts and can often be charged using mini-grids, which are more reliable in areas with limited main grid access. Projections suggest that annual sales of electric two-wheelers in Kenya and Nigeria could reach 3–4 million units by 2040. Additionally, battery-swapping stations offer a quick solution for commercial motorcycle taxi drivers, allowing them to replace depleted batteries in minutes.
For four-wheel vehicles, Level 2 chargers are a more economical option. These chargers, costing between $200 and $1,000, can provide 20–130 kilometers of range per hour, making them ideal for workplaces or commercial centers where vehicles remain parked for extended periods. On the other hand, DC fast chargers (Level 3) are significantly more expensive, with costs running into tens of thousands of dollars per unit. These chargers can add 5–30 kilometers of range per minute, making them suitable for high-traffic commercial corridors. Given the constraints in rural Africa – such as limited grid capacity and lower traffic volumes – Level 2 chargers should be prioritized at key hubs, while fast chargers should be reserved for areas where heavy usage justifies the investment.
Practical Applications and Case Studies
Data-Driven Site Selection Models
Using layered data to determine the best locations for charging stations has proven to be a game-changer. Between 2023 and 2024, the IEA and Power Africa introduced the Open Energy Maps Model. This machine learning tool, trained on geo-referenced electricity consumption data from utility meters in Ghana, Senegal, and Uganda, predicts electricity demand for buildings that don’t yet have power. By doing so, it helps planners size infrastructure accurately before construction even begins, cutting error rates by 40% compared to traditional methods.
Geographic Information Systems (GIS) add another layer of sophistication by integrating data like population distribution, renewable energy resources, and existing grid infrastructure into a single, comprehensive map. Tools like the Energy Access Explorer allow planners to identify supply-demand gaps across regions. This is especially helpful in pinpointing communities with higher affordability, which can justify extending infrastructure into more remote areas.
For paratransit vehicles, such as matatus and buses, the high demand at transport hubs like termini creates challenges for grid capacity. A study focusing on Nairobi’s 8,400 distribution substations simulated the effects of 1.6 million households adopting EVs. At just 5% EV penetration, about 1% of transformers showed signs of overloading. However, by implementing smart charging during off-peak hours, potential transformer replacement costs could drop by up to 40%.
These data-driven approaches are setting the stage for practical, real-world applications.
African Success Stories
Real-world examples highlight how data-driven planning can lead to rapid progress in EV infrastructure. Ethiopia’s "EV Pivot" is a standout case. Leveraging its 90% hydropower capacity, the country achieved a 40% compound annual growth rate (CAGR) in EV imports between 2021 and 2025. This surge prompted Ethio eMobility Solutions to install over 200 AC chargers across Addis Ababa. Founded in 2022, the company aligned its efforts with Ethiopia’s 10-Year Transport Sector Development Plan and the anticipated demand from the 2024 internal combustion engine (ICE) ban. By 2030, Ethiopia’s charging infrastructure market is projected to reach $100–150 million.
In Kenya, BasiGo adopted a commercial-first strategy by focusing on urban routes with high public transport usage, where 60–80% of trips rely on buses. By May 2025, the company had deployed 100 electric buses and secured $42 million in funding to expand its fleet to 1,000 buses across Kenya and Rwanda. Their planning was rooted in data showing that operating an EV in Kenya is 47–83% cheaper than using an internal combustion engine vehicle, making the financial benefits clear for fleet operators.
First Universal Fast-Charging for Light Electric Vehicles in Africa
Conclusion: The Path Forward for Rural EV Charging in Africa
Developing EV charging infrastructure in rural Africa demands informed, data-driven strategies. As Rose Mutiso, Research Director at the Energy for Growth Hub, explains:
"Africa’s electric vehicle future can’t be built on guesswork".
The metrics discussed in this guide – covering population density, grid reliability, geospatial mapping, and smart charging models – offer a roadmap for building cost-effective infrastructure. This approach could help address the needs of the 600 million people who still lack access to electricity.
New tools are also improving the planning process. For instance, the Open Energy Maps Model, introduced by the International Energy Agency (IEA) and MIT in March 2024, has significantly enhanced accuracy. It reduces demand estimation errors by 40% and achieves over 80% accuracy in identifying electrified buildings. Additionally, smart charging strategies can lower transformer replacement costs by 15% to 40%, contributing to the financial sustainability of the grid.
"Comprehensive data and insights are crucial to empower investors with market clarity, enable companies to scale, and equip policymakers to tailor and champion EV agendas effectively." – Energy for Growth Hub
Access to vehicles is another vital piece of the puzzle. Platforms like EV24.africa simplify the process by handling customs clearance, local registration, and delivery across 54 African markets. Entry-level EVs, such as the Geely Panda Mini Base priced at $5,880, and utility models like the Dongfeng DF6 EV at $38,560, make EV ownership more attainable for individuals and businesses alike.
FAQs
What’s the minimum demand needed to justify a rural charging site?
The demand for a rural charging site hinges on factors such as population density and local energy requirements. Although exact thresholds aren’t specified, rural areas with lower energy costs and fewer infrastructure options may still warrant a charging station, even with relatively modest use. This highlights the importance of thoroughly assessing local conditions before setting up charging facilities.
How do smart charging schedules prevent transformer overloads?
Smart charging schedules help avoid transformer overloads by carefully managing when and how electric vehicles (EVs) are charged. By using real-time data and considering the transformer’s capacity, these schedules spread out the demand more evenly. This not only reduces peak load but also lowers the chances of overloading, ensuring the electrical grid operates more smoothly and efficiently.
When should a rural site use mini-grids instead of the main grid?
Mini-grids work well in rural areas where connecting to the central grid isn’t practical or is too expensive. This is common in places with sparse populations, remote locations, or where infrastructure costs are particularly high. In these cases, off-grid renewable energy systems often make more sense both financially and logistically.